One of the types of frontend I’ve been looking into recently is the use of rust. Rust now has the ability to be compiled into a web assembly target. You can then take that and use it as part of a web page or desktop application such as tauri.
There’s a few different web frontends for rust now, yew seems to be the most popular, leptos the fastest at updates.
If you try and google debugging rust wasm, most of the results say it’s not currently possible. However there have been a few different developements including extensions for the browser that seem to have made this now workable. This involves the use of the Dwarf proposal for generating source maps.
Install some needed tools
The first thing we’re going to need is a couple of tools, the first being the wasm compiler for rust.
The next being a rust utility called trunk, trunk automates away some of the complexity of compiling rust to wasm
under the hood it actually uses wasm-bindgen to handle the actual compiling.
If we use the nightly toolchain then we gain some additional features while using leptos.
# We need the wasm target for rust
rustup target add wasm32-unknown-unknown
# The trunk utility for building rust to wasm
cargo install trunk
# If we use the nightly toolchain we gain some features from leptos
rustup toolchain install nightly
Setting up a demo project
Next we’re going to setup a demo project using leptos
cargo init dummy_project
cd dummy_project
cargo add leptos --features=csr,nightly
cargo add console_error_panic_hook console_log log
rustup override set nightly
Create the root index html
Lets create a index.html file.
Note the data-keep-debug="true" statement, this sends a message to trunk to pass along the --keep-debug option to wasm-bindgen. This in turn then bundles in the Dwarf source mapping we need.
<!DOCTYPE html>
<html>
	<head>
		<link data-trunk rel="rust" data-keep-debug="true" data-wasm-opt="z"/>
		<link data-trunk rel="icon" type="image/ico" href="/public/favicon.ico"/>
	</head>
	<body></body>
</html>
Edit the main.rs file
Next lets change the src/main.rs file
use dummy_project::SimpleCounter;
use leptos::*;

pub fn main() {
    _ = console_log::init_with_level(log::Level::Debug);
    console_error_panic_hook::set_once();
    mount_to_body(|| {
        view! {
            <SimpleCounter
                initial_value=0
                step=1
            />
        }
    })
}
Create a lib.rs file
Next create a src/lib.rs file
use leptos::*;

/// A simple counter component.
///
/// You can use doc comments like this to document your component.
#[component]
pub fn SimpleCounter(
    /// The starting value for the counter
    initial_value: i32,
    /// The change that should be applied each time the button is clicked.
    step: i32,
) -> impl IntoView {
    let (value, set_value) = create_signal(initial_value);

    view! {
        <div>
            <button on:click=move |_| set_value.set(0)>"Clear"</button>
            <button on:click=move |_| set_value.update(|value| *value -= step)>"-1"</button>
            <span>"Value: " {value} "!"</span>
            <button on:click=move |_| {
                // Test Panic
                //panic!("Test Panic");
                // In order to breakpoint the below, the code needs to be on it's own line
                set_value.update(|value| *value += step)
            }
            >"+1"</button>
        </div>
    }
}
Create a favicon file
For some reason trunk fails to run if there’s a missing public/favicon.ico file. Create one of these so that trunk will build.
Initial build
At this stage we should now be able to try out an initial build / run of the application.
trunk build
trunk serve
This should give us a very basic counter app we can play around with. Next we’ll look at adding in some changes to allow debugging and breakpointing the web assembly.
Installing Debugging Extensions
Browser Extension
The first thing we’re going to need is a new browser extension. This should allow chrome or opera to interpret the Dawrf source code mapping and display the original rust source in the browser dev window.
It’s intended for C++ but seems to work fine with rust as well.
VSCode Extension
In order for visual studio code to understand the Dwarf source code mapping we also need to install an extension here.
Setting up vscode settings for Debugging
Next we’re going to create a couple of files for debugging under vscode
.vscode/launch.json
{
    "version": "0.2.0",
    "configurations": [
        {
            "name": "Launch Browser Chrome",
            "request": "launch",
            "type": "chrome",
            "url": "http://localhost:8080",
            "webRoot": "${workspaceFolder}/dist",
            // Needed to keep the dwarf extension in the browser
            "userDataDir": false,
            "preLaunchTask": "trunk: serve",
            "postDebugTask": "postdebugKill"
        },
    ]
}
The tasks file just makes launching and stopping trunk easier from within vscode
.vscode/tasks.json
{
	"version": "2.0.0",
	"tasks": [

		// Task to build the sources
		{
			"label": "trunk: build",
			"type": "shell",
			"command": "trunk",
			"args": ["build"],
			"problemMatcher": [
				"$rustc"
			],
			"group": "build",
		},

		// Task to launch trunk serve for debugging
		{
			"label": "trunk: serve",
			"type": "shell",
			"command": "trunk",
			"args": ["serve"],
			"isBackground": true,
			"problemMatcher": {
				"pattern": {
					"regexp": ".",
					"file": 1,"line": 1,
					"column": 1,"message": 1
				},
				"background": {
					"activeOnStart": true,
					"beginsPattern": ".",
					"endsPattern": "."
				}
			}
		},

		// Terminate the trunk serve task
		{
			"label": "postdebugKill",
			"type": "shell",
			"command": "echo ${input:terminate}",
		},
	],
	"inputs": [
		{
			"id": "terminate",
			"type": "command",
			"command": "workbench.action.tasks.terminate",
			"args": "terminateAll"
		}
	]
}
Debugging Wasm
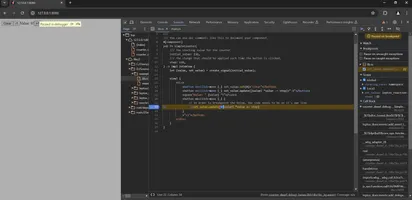
At this point if we launch Chrome from the Debug Menu within VSCode. We should see this within the chrome browser dev window.

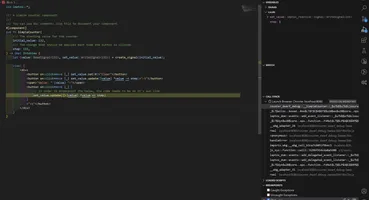
We can also add breakpoints within VSCode such as on a button click now as well.


